The Latest Headlines at Defense World
First Defense Talks in 18 Months: US, China Seek to Manage Competition
Key Points: U.S. Defense Secretary Lloyd Austin and Chinese Defense Minister Adm. Dong Jun spoke for the first time in 18 months, marking a thaw in military communications. The talks centered on managing tensions, emphasizing... More of this article »
Netherlands Allocates Significant Military Aid for Ukraine
Key Points: The Netherlands firmly supports Ukraine’s defense, committing €4 billion in military aid over 2024-2026 and increasing its defense budget. The Netherlands prioritizes replenishing air defense and ammunition... More of this article »
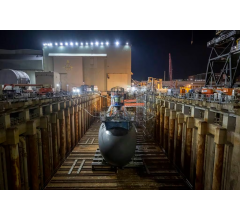
Brazil Seeks Modern Maritime Patrol Fleet
Brazil’s Air Force (FAB) is taking significant steps to modernize its maritime patrol capabilities, a mission vital to protecting its vast coastline and offshore resources. The FAB is collaborating with the nation’s flagship... More of this article »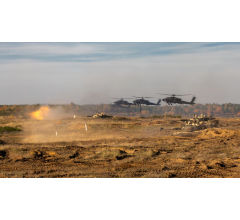
Record-High Military Sales for the United States
Key Points Russia’s assault on Ukraine has spurred a significant arms procurement surge worldwide, with the United States benefiting from increased sales and a strengthening of defense partnerships. European nations,... More of this article »
Microchips and Missiles: Russian Defense Contractor Violates Sanctions
The global effort to isolate Russia economically continues to face determined opposition within Russia itself. In a striking case of sanctions evasion, a prominent Russian microchip manufacturer has been caught red-handed supplying... More of this article »
Norway to Sharply Increase Defense Spending
In a move signaling a significant shift in national priorities, Norway’s government has announced a historic increase in defense spending. This surge in investment aims to modernize the nation’s armed forces and bolster its... More of this article »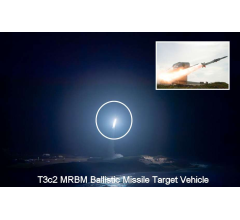
Northrop Grumman Launch Boosts Missile Defense Testing
Northrop Grumman Corporation’s successful launch of a Medium-Range Ballistic Missile Type 3 Configuration 2 (MRBM T3c2) Target Vehicle marks a significant milestone in US missile defense development. Conducted in collaboration... More of this article »
South Korea Propels Military AI Development
South Korea has taken a decisive step towards securing a technological advantage in the evolving defense landscape by establishing a dedicated Defense AI Center. This strategic initiative reflects the growing recognition of artificial... More of this article »
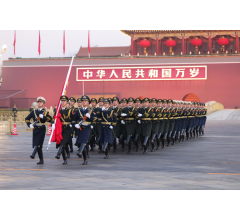
Pakistan Showcases Domestic Defense Programs at Pakistan Day Parade
On March 23rd, 2024, Pakistan commemorated its national holiday, Pakistan Day, with a grand military parade in the capital city, Islamabad. This annual event celebrates national pride and provides a platform for the country’s... More of this article »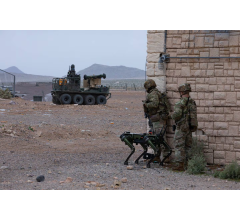
US Army Integrates Humans and Machines on the Battlefield
Key Points: The U.S. Army is actively developing integrated combat formations where both robotic systems and human soldiers operate as a coordinated force. The primary goal is to reduce risks to soldiers and increase battlefield... More of this article »
General Urges Global Action to Stem Worsening Haiti Crisis
Key Points: Haiti grapples with unchecked gang violence, a political power vacuum, extreme poverty, and a breakdown of essential institutions. This interconnected web of problems is pushing the nation deeper into chaos. General... More of this article »
Russia Warns SpaceX: Military Use of Satellites Invites Retaliation
Key Points Russia has accused the US of using commercial satellites for military intelligence and threatened countermeasures. SpaceX is developing a network of sophisticated spy satellites under a classified contract with a... More of this article »
Propelling Israel into the Space Race
In the midst of ongoing conflicts and rising tensions in the Middle East, Israel is venturing into a new frontier: space. The Israel Defense Forces (IDF), renowned for its prowess in conventional warfare, has launched its Space Directorate... More of this article »